
本文来自微信公众号: 城读 ,作者:CityReads,原文标题:《CityReads | Chinese Are Getting Taller and Fatter》
At the beginning of the New Year,it’s customary to set New Year’s resolutions.Have you planted your New Year weight-loss flag yet?
You are not alone.In highly urbanized societies,sedentary lifestyles are increasingly pervasive,high-calorie processed foods are readily available,and obesity rates rise accordingly.Coupled with a fashion culture that equates thinness with beauty,weight loss has become a widespread social phenomenon—regardless of whether one is truly overweight.
Over the past four decades,China has experienced the largest and fastest economic growth,industrialization,urbanization,population aging,and health transition in its history.Living standards have improved markedly,nutritional intake—especially of animal protein—has increased,and the height of adolescents and young adults has risen rapidly.At the same time,however,average body weight has also increased,along with the prevalence of overweight and obesity.Chronic non-communicable diseases(hereafter referred to as chronic diseases),such as cardiovascular and cerebrovascular diseases,cancer,chronic respiratory diseases,and diabetes,have become the leading causes of death and disease burden among residents.In 2021,chronic diseases accounted for 88.89%of deaths among rural residents in China and 90.34%among urban residents(seeCityReads|How We Die?).Obesity is a major risk factor for many diseases,including heart disease,stroke,diabetes,and multiple types of cancer.It is estimated that in 2019,around five million people worldwide died prematurely due to obesity,making it one of the leading causes of death globally.
After more than four decades of economic growth and rising living standards,how much have the height and weight of Chinese people increased?How widespread—or how limited—are the problems of overweight and obesity?With these questions in mind,I collected the successive National Physical Fitness MonitoringReports released by the General Administration of Sport of China(GASC)and analyze them one by one below.
Overall,Chinese people have grown taller,especially the younger generations.Body weight and body fat percentage have also continued to rise,with the prevalence of overweight and obesity increasing steadily.At the same time,however,muscle strength among adults has shown a persistent downward trend.
Since 2000,China has completed six rounds of the National Physical Fitness Monitoring Survey,conducted once every five years.On December 28,2025,GASCreleased the Sixth National Physical Fitness MonitoringReport.The latest survey adopted a multistage stratified random cluster sampling method.The surveyed population included children aged 3–6,adults aged 20–59,and older adults aged 60–79,covering all 31 provinces,autonomous regions,and municipalities on the Chinese mainland,with an effective sample size of nearly 243,600 individuals.
Height
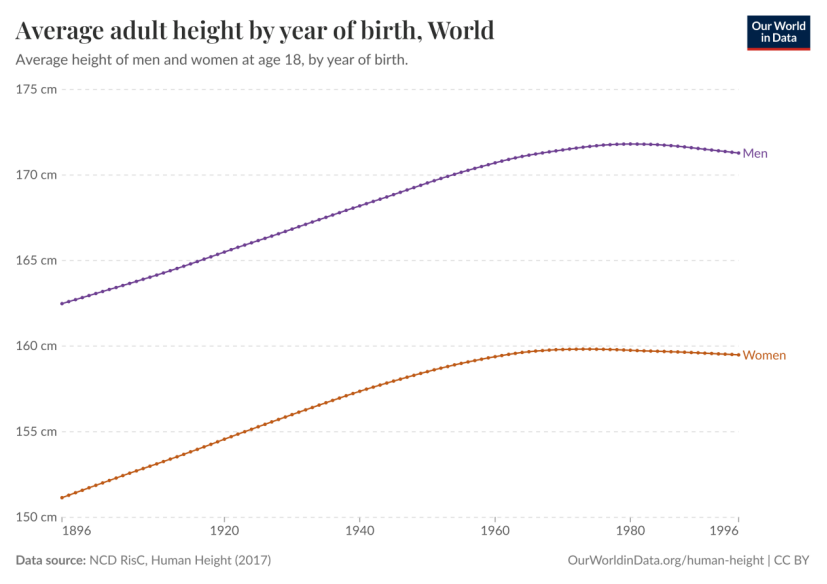
Average population height is closely correlated with living standards.
For example,the Netherlands today has the tallest population in the world.In 2025,the average height of Dutch men reached 1.83 meters,while Dutch women averaged 1.70 meters.Yet in the early 19th century,Dutch men were among the shortest in Europe,with an average height of only 1.63 meters.In the late 19th and early 20th centuries,the Netherlands underwent major social and economic transformations.Public health reforms improved sanitation and reduced disease,while growing prosperity made milk,meat,and cheese widely available,leading to a steady increase in average height.
If we compare adults today with those born a century ago,the global average height of both men and women has increased by about 10 centimeters.As shown in the figure below,adult men born in 1896 had an average height of 1.62 meters,compared with 1.71 meters for those born in 1996;adult women born in 1896 averaged 1.51 meters in height,while those born in 1996 averaged 1.59 meters.
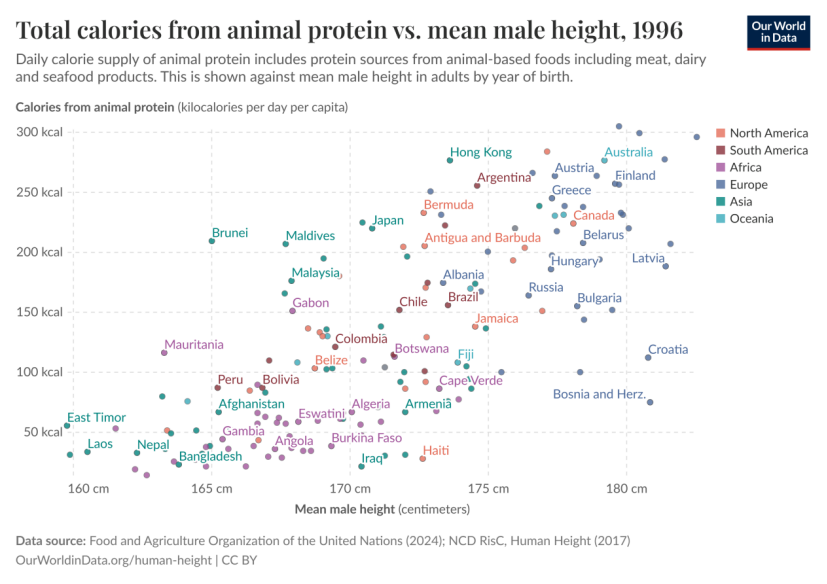
Research shows a strong association between the consumption of animal-based foods and height:populations in countries with higher intakes of animal protein tend to be taller.
As illustrated in the figure below,the heights of Chinese adult men by age group from 2010 to 2025 show clear patterns.
Comparing different age groups within the same period,younger cohorts are consistently taller than older ones.For example,in 2025,the tallest group was men aged 20–24,with an average height of 1.74 meters,while the shortest group was those aged 55–59,averaging 1.68 meters.Comparing the same age group across different periods,average height also shows an upward trend.For instance,the average height of men aged 20–24 increased from 1.71 meters in 2010 to 1.74 meters in 2025.
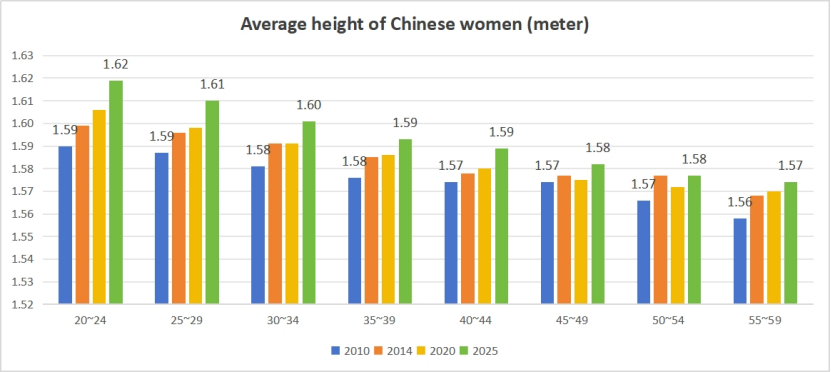
Women’s height shows the same pattern.In 2025,the tallest group was the youngest cohort aged 20–24,with an average height of 1.62 meters,while the shortest group was the oldest cohort aged 55–59,averaging 1.57 meters.Even so,this represents an increase of 1 centimeter compared with the same age group in 2010,when the average height was 1.56 meters.In short,for both men and women,younger generations in China are becoming taller.
Source:GASC
Body Weight and Obesity
At the same time,body weight has continued to increase.The most commonly used measure of obesity is the body mass index(BMI).
BMI is calculated as body weight(in kilograms)divided by height squared(in meters):kg/m².
BMI values are used to determine whether an individual is considered underweight,healthy,overweight,or obese.
For adults,the World Health Organization defines BMI categories as follows:a BMI below 18.5 is considered underweight;a BMI between 18.5 and 25 is considered normal or healthy;a BMI between 25 and 30 is considered overweight;and a BMI above 30 is considered obese.Note that these standards do not apply to children or pregnant women.
In 2016,it was estimated that around two-fifths of adults worldwide were overweight or obese.
However,BMI is not a perfect indicator for assessing dietary and body-composition–related health risks and has several limitations.One major limitation is that BMI treats all body weight—including fat,muscle,organs,and bonestructure—as posing equal health risks.In reality,higher muscle mass and greater bone density are beneficial to health.As a result,athletes or people who regularly exercise or train may have a relatively high BMI due to greater muscle mass,even if their body fat percentage is low or within a healthy range,leading them to be classified as overweight.With aging,muscle mass and bone density tend to decline,meaning that older adults may have a higher body fat percentage than younger individuals with the same BMI.At the same BMI,women generally have a higher body fat percentage than men.
BMI also cannot distinguish between high and low body fat percentages,nor can it differentiate visceral fat from subcutaneous fat.Visceral fat is most strongly associated with adverse health outcomes,whereas subcutaneous fat is less closely linked to health risks.Women typically carry more subcutaneous fat,while men tend to accumulate more visceral fat.
In addition,because people of Asian tend to store more visceral fat,they face higher health risks at lower BMI levels.As a result,the BMI threshold for elevated risk among Asians is lower than 25.For this reason,the BMI categories used in China’s National Physical Fitness MonitoringReports are defined as follows:BMI<18.5 is classified as“underweight,”18.5≤BMI<24.0 as“normal weight,”24.0≤BMI<28.0 as“overweight,”and BMI≥28.0 as“obese,”which are lower thresholds than those of the WHO.
Even so,BMI remains the primary indicator used worldwide to assess health risks related to diet and body composition.Although it may be unsuitable for certain individuals,at the population level it provides a good reflection of health risks associated with obesity.
National Physical Fitness Monitoring data since 2000 show a continuous upward trend in overweight and obesity rates among Chinese adults and older adults.According to the Fifth National Physical Fitness Monitoring Bulletin,in 2020 the prevalence of overweight and obesity among Chinese adults was 35.0%and 14.6%,respectively,while among older adults the corresponding rates were 41.7%and 16.7%.
The Sixth National Physical Fitness MonitoringReportnotes that“among adults,the prevalence of overweight and obesity is 1.7 percentage points lower,and body fat percentage is 1.0 percentage point lower,in those who regularly participate in physical exercise compared with those who do not.Strength training also plays an important role in weight control:adults and older adults who engage in strength training have body fat percentages that are 1.4 and 0.5 percentage points lower,respectively,than those who do not.”
It is worth noting that underweight individuals account for a certain proportion of both young women aged 20–30 and women aged 60 and above.This is particularly evident among urban women aged 20–24(nearly 15%)and rural women aged 75 and above(nearly 5%).The former are highly likely to be over-dieting,while the latter are more prone to sarcopenia.Being underweight also carries health risks,and a healthy body weight should be promoted—strength comes with muscle.
Therefore,for individuals who are medically diagnosed as obese,weight loss is an important means of improving health.However,for those who are physically inactive and lack muscle mass—especially older women who are at higher risk of sarcopenia—building muscle is a crucial pathway to improving quality of life and overall health.
As shown in the figure below,BMI levels among Chinese adult men by age group from 2010 to 2025 increase with age.Moreover,between 2010 and 2025,BMI rose across all age groups.By 2025,the BMI of all age groups aged 25 and above exceeded 24,and for those aged 30 and above,BMI exceeded 25.
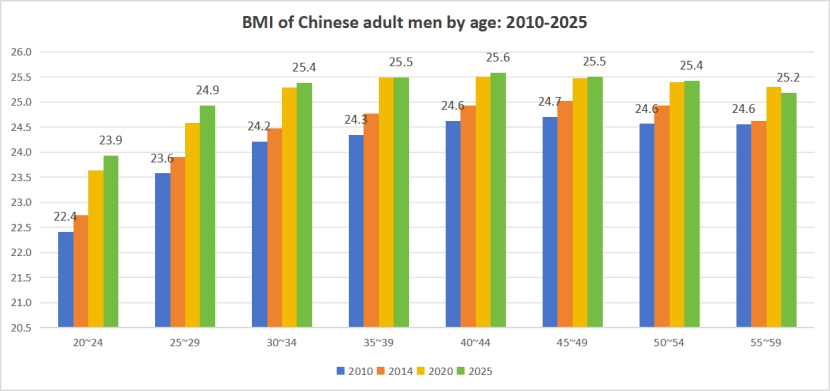
Source:calculated based on data from GASC
The next figure shows BMI levels among Chinese adult women by age group from 2010 to 2025.BMI likewise increases with age.In 2025,BMI in the 40–59 age groups exceeded 24.The good news is that BMI in the 50–59 age group declined slightly compared with 2020.
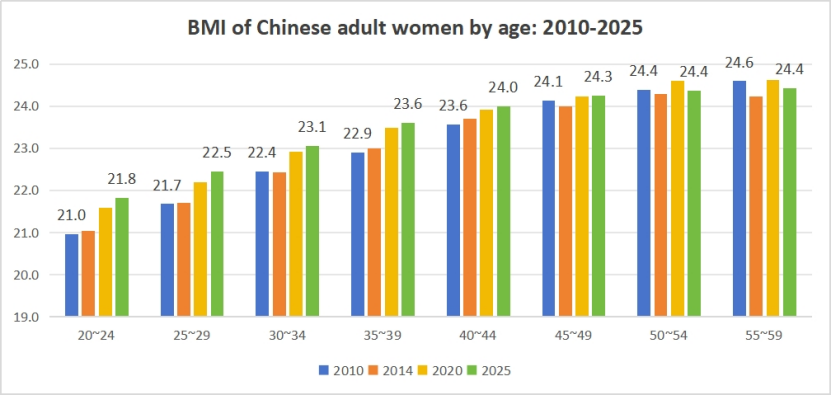
Source:calculated based on data from GASC
There is an indicator that reflects health risks better than BMI:the waist-to-hip ratio.
The waist-to-hip ratio(WHR)is the ratio of waist circumference to hip circumference and is an important indicator for assessing central obesity(abdominal fat accumulation)and overall health risk.It reflects the distribution of fat between the abdominal(visceral)region and the hips and thighs.For men,a WHR below 0.9 is considered low risk,0.91–0.95 medium risk,and above 0.95 high risk.For women,a WHR below 0.8 is considered low risk,0.81–0.85 medium risk,and above 0.86 high risk.
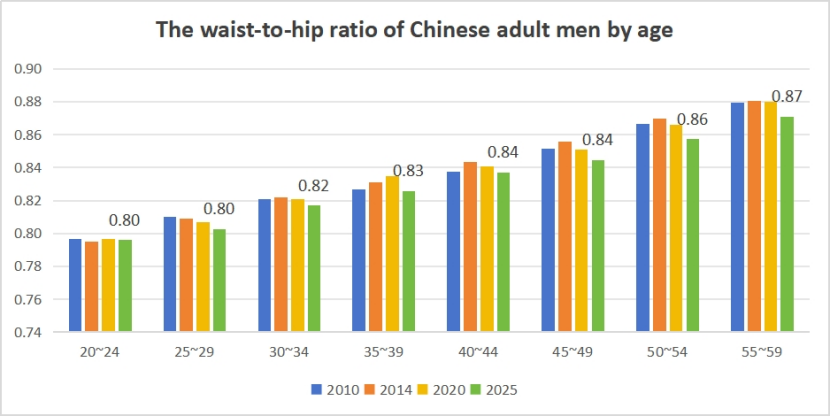
The figure below shows waist-to-hip ratios among Chinese adult men by age group.WHR increases with age,and all age groups above 35 have WHR values above 0.9.

Source:calculated based on data from GASC
Data for Chinese adult women by age group show a similar age-related increase in WHR:groups aged 50 and above exceed 0.85,indicating elevated risk.The good news is that in 2025,WHR declined slightly across almost all age groups.Older women have the highest WHR,and all groups aged 65 and above exceed 0.9,which warrants particular attention.
Source:calculated based on data from GASC
China began to include body fat percentage testing starting with the Fifth National Physical Fitness Monitoring Survey.
The gold standard for body composition assessment,including body fat percentage,is DEXA.DEXA(dual-energy X-ray absorptiometry)uses low-dose X-rays to directly distinguish and measure three types of tissue—fat,muscle,and bone—providing precise regional and whole-body data on body fat,muscle mass,bone mineral content,and bone density,with typical errors of only 1–3%.In scientific research,DEXA is recommended for measuring body fat percentage.This method is the most accurate,but it is also very expensive:a single machine can cost over one million yuan.
Most commercially available body fat scales and analyzers use bioelectrical impedance analysis(BIA).Because devices from different manufacturers vary in the number of electrodes used,as well as in the samples and reference systems on which their estimation equations are based,their accuracy can differ.BIA sends a weak electrical current through the soles of the feet(or hands and feet)and measures the body’s resistance(impedance),then estimates body fat using preset formulas.Fat conducts electricity poorly,whereas muscle and water conduct it well.As a result,BIA is essentially an indirect estimation method that ignores differences in bone density,leading to an underestimation of body fat percentage(or an overestimation of muscle mass).Therefore,body fat percentages measured by BIA are not directly comparable to those measured by DEXA.Multiple studies have shown that BIA-derived body fat percentages are on average 3–10 percentage points lower than those measured by DEXA.
DEXA-based body fat measurement has not yet been widely adopted in China.To my knowledge,only some public hospitals in Beijing currently offer it,while in Shanghai it is available at only two private institutions.Although many top-tier hospitals are equipped with DEXA machines,they are used solely for bone density measurements.One physician told me that Shanghai’s medical insurance system has not established a billing item for body fat percentage measurement,making it unavailable.
This shows that the body fat analyzer uses bioelectrical impedance analysis(BIA)technology to measure body fat percentage,and its accuracy cannot be compared with that of DEXA.The body fat percentages reported below are therefore BIA-based estimates and are lower than actual body fat levels;they are presented here to illustrate trends.From 2020 to 2025,body fat percentage increased across all age groups for both men and women.
Among men,the 40–44 age group has the highest body fat percentage,while the 20–24 age group has the lowest.
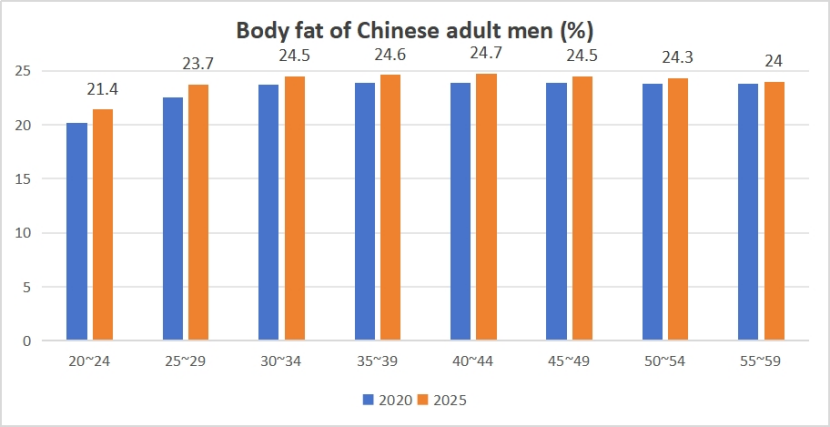
Source:GASC
For women,body fat percentage generally increases with age.The 65–74 age group has the highest body fat percentage,while it declines slightly in the 75–79 age group;the lowest body fat percentage is observed among women aged 20–24.
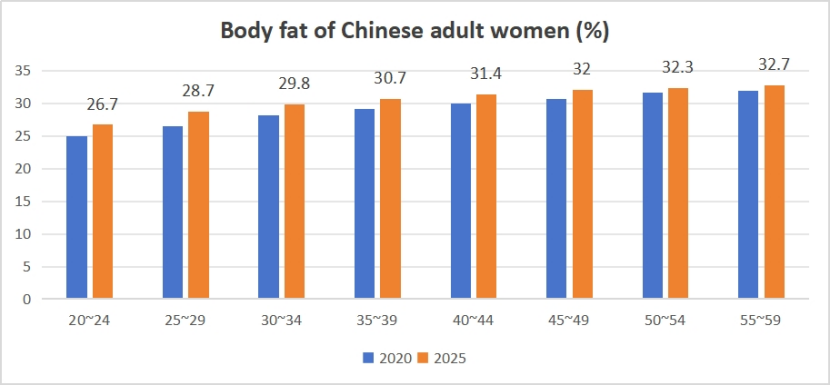
Source:GASC
The report also highlights a worrying trend:from 2000 to 2025,“muscle strength among Chinese adults has shown a continuous downward trend,with the decline being more pronounced among men.Average grip strength among adult men fell from 45.8 kg in 2000 to 42.1 kg in 2025,while average grip strength among adult women declined from 28.4 kg to 26.3 kg.Grip strength decreased across all adult age groups,with the most pronounced decline occurring in the 40–49 age group.”
Therefore,in the New Year,everyone should place greater emphasis on strength training and building muscle strength.Wishing everyone a healthy New Year—build plenty of muscle,keep visceral fat nice and low,and boost your bone density sky-high!